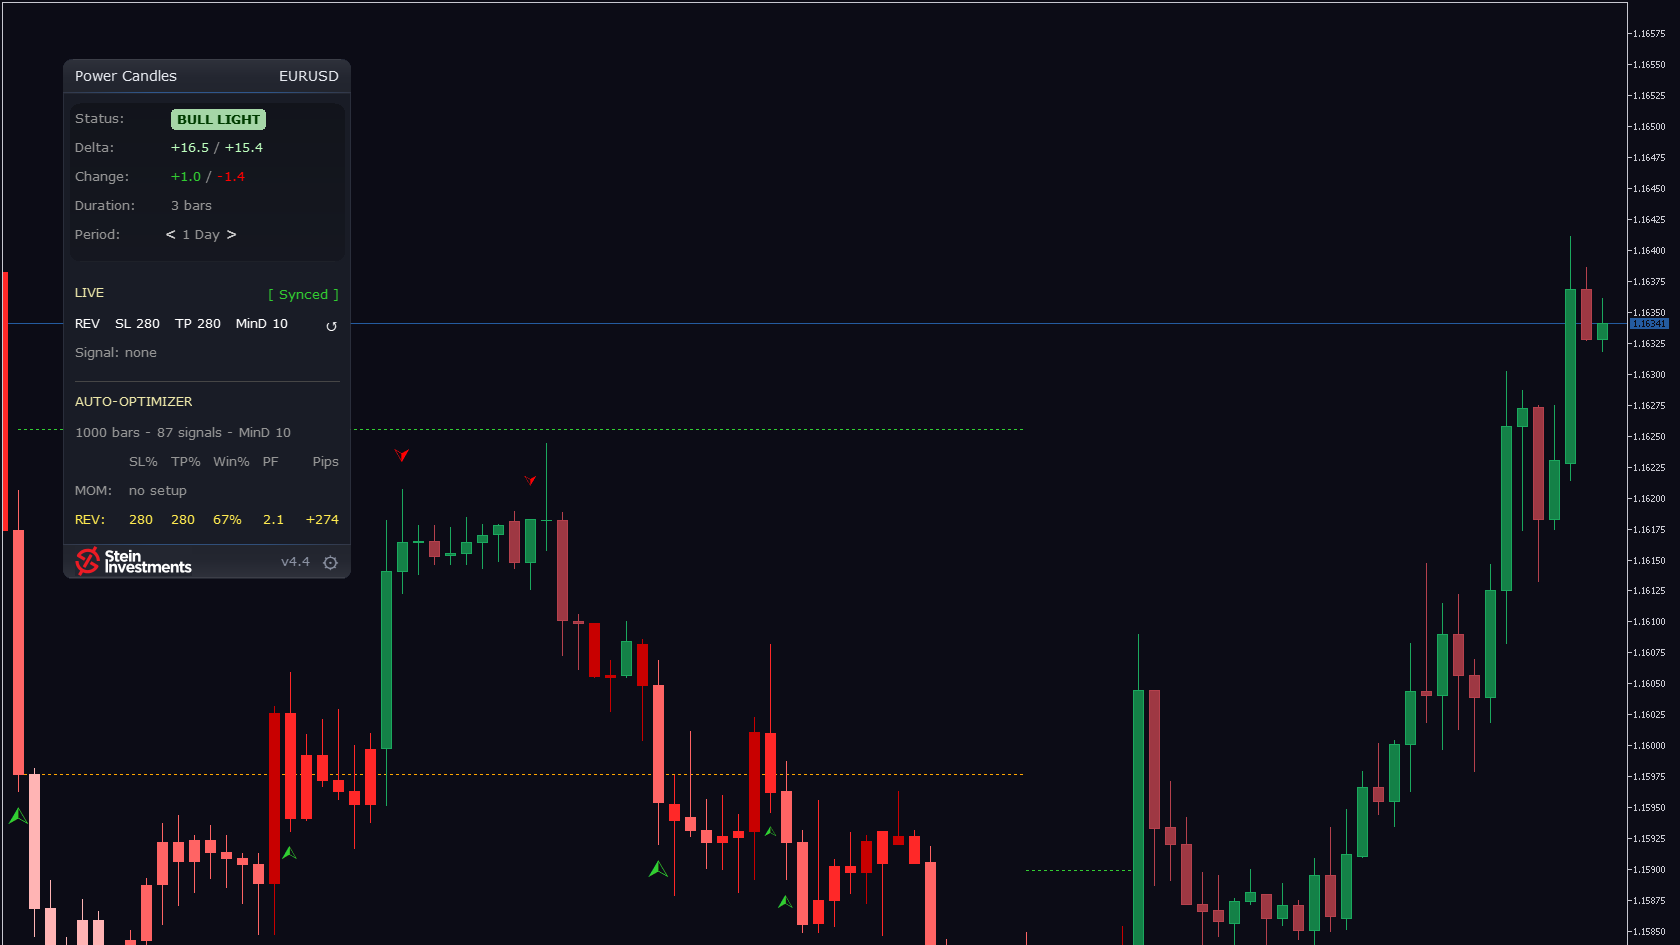
Strength indicators used to live in a sub-window. The line ran below, the candle above, and I kept connecting the two by eye.
So I put the strength into the candle itself. Power Candles colors every candle by the relative strength of the currencies or instruments behind it, from dark red through grey to dark green, and the chart reads at a glance: you see whether a trend is carried by real strength while your eye stays on the price. The strength logic is built in, so Power Candles runs on its own, on forex pairs, gold, indices and crypto, from M1 up to the monthly chart.
While I was building it, the indicator began testing its own strategies, and today it finds its own settings. Every time the chart loads and on every closed bar it runs more than 3,000 trade simulations for the symbol and timeframe in front of you, and the AUTO-OPTIMIZER panel shows the setup that came out on top. One click on Apply Best adopts it: the arrows redraw, entry, stop and target appear as lines at the exact prices, and your alerts carry direction, stop and target. Switch on Auto-apply best and the chart follows the best setup by itself, and a change of setup waits until the open trade has closed. For me it has become indispensable.
On the MQL5 Market it stands at 4.7 out of 5. As long as symbol, timeframe and strategy stay the same, an arrow on a closed candle stays exactly where it was drawn.
Two things to know before you buy. The best setup is the one that did best on the past candles of that chart: a record of history, and the call on the next trade stays yours. When a market has produced too few signals for a solid result, the panel says so and shows the classic momentum view until a setup qualifies again. And Power Candles lives in the MetaTrader 5 terminal; the demo that MQL5 attaches to it runs in the Strategy Tester, with the panel clickable and Apply Best included.
This is week two of the autumn series: seven weeks, seven of my tools, each with its own week and exactly once, in a fixed order. Power Candles holds 79 USD instead of 99, 20% below the list price, until Sunday 20 September. Sunday night the list price is back, and it stays there.
Have a look, and see how your chart reads once the strength sits in the candle.