 Power Bar Signal Analysis
 Trade the extreme candle with a measured edge.
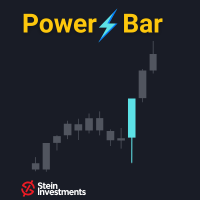
Power Bar flags extreme candles (body past an ATR multiple you set) and backtests three strategies on them (FlipFlop, Momentum, Reversal), so you see which one has an edge on your instrument before you trade it. Live stats on a glass panel, interactive tuning saved per symbol. MT5 only.

Where it came from
Three answers from Daniel.
The gap
A candle ran far past its neighbors, and what came next was anyone's guess. Signal indicators gave me an arrow to trust.
The idea
See how the market behaves after such candles. Three readings, each tested against the history of the chart I trade.
What makes it special
The first time we backtested a strategy this way, on the chart. Later it moved into Power Candles.
About Power Bar
Most signal indicators hand you an arrow and leave you to trust it. Power Bar hands you the arrow and the evidence behind it. It flags extreme candles (where the body runs past a multiple of the ATR you set) and backtests three strategies on them: FlipFlop, Momentum and Reversal, with the win rate, trade count and total result live on the chart. Before you act on a signal type, you see whether it has held an edge on the instrument and timeframe you actually trade.
Key Features
- Detects extreme candles where the body exceeds your chosen multiple of the ATR
- Backtests three strategies on those candles: FlipFlop, Momentum and Reversal
- Live stats per strategy, the same rows in every tab: total result, profit factor, win rate, trade count, average and largest win and loss
- Interactive +/- buttons to retune the ATR multiplier, period and SL/TP right on the panel
- Your setup stays: the active tab and your setup values come back after a timeframe change, a symbol change or a terminal restart, the setup values kept per symbol
- Green and red arrows marking the confirmed extreme bars, drawn behind the candles so each candle stays readable
- Entry, Stop Loss and Take Profit lines on the chart in the Momentum and Reversal tabs: fine and dotted for past signals, solid and labelled for the strategy's open trade
- Glass panel with one height in every tab and a context line for symbol, timeframe and history depth, foldable to a single line with tab, profit factor and trades
- Settings page behind the gear: switches for arrows, lines, alerts and alert channels (popup, push, sound), the alert switches saved per chart
- ATR period presets from 10 to 50
- MT5 only
How traders use it
Open Power Bar on the instrument you trade, set the ATR period to your usual volatility baseline, and cycle through the three strategy tabs: each shows its own backtested numbers immediately. A 62% win rate over 80-plus Momentum trades on XAUUSD H1 is a data point worth acting on; a 38% Reversal read over the same sample tells you that approach does not belong on that chart. The real value is the side-by-side: you see which of the three actually fits the instrument in front of you.
The +/- buttons make that tuning fast during a live session. Nudge the ATR multiplier up or down and the signals and stats recalculate on the spot: the tuning happens right on the panel, in a tap. In the Momentum and Reversal tabs, the on-chart Entry, Stop and Take Profit lines give you a visual reference for where the strategy expects the move to run, useful for sizing the position before you enter.
Supported markets
Every symbol in your MT5 terminal: forex, metals, indices, crypto, stocks and commodities. The ATR calculation adjusts to the chart timeframe automatically.
Getting started
Attach Power Bar to any chart in MT5 and pick a starting strategy tab: the statistics populate from history immediately. From there, compare the three tabs on your instrument and use the +/- buttons to find the ATR multiplier that gives you the signal frequency and quality you want.
Works great with
Power Bar Scanner runs the same detection across your whole watchlist, so a signal on an instrument you were not watching still reaches you. Smart Stop Indicator combines well for stop placement: a structural SL level to set against Power Bar's ATR-based one. And once you decide to act, Premium Trade Manager sizes and places the trade, fast and precise.