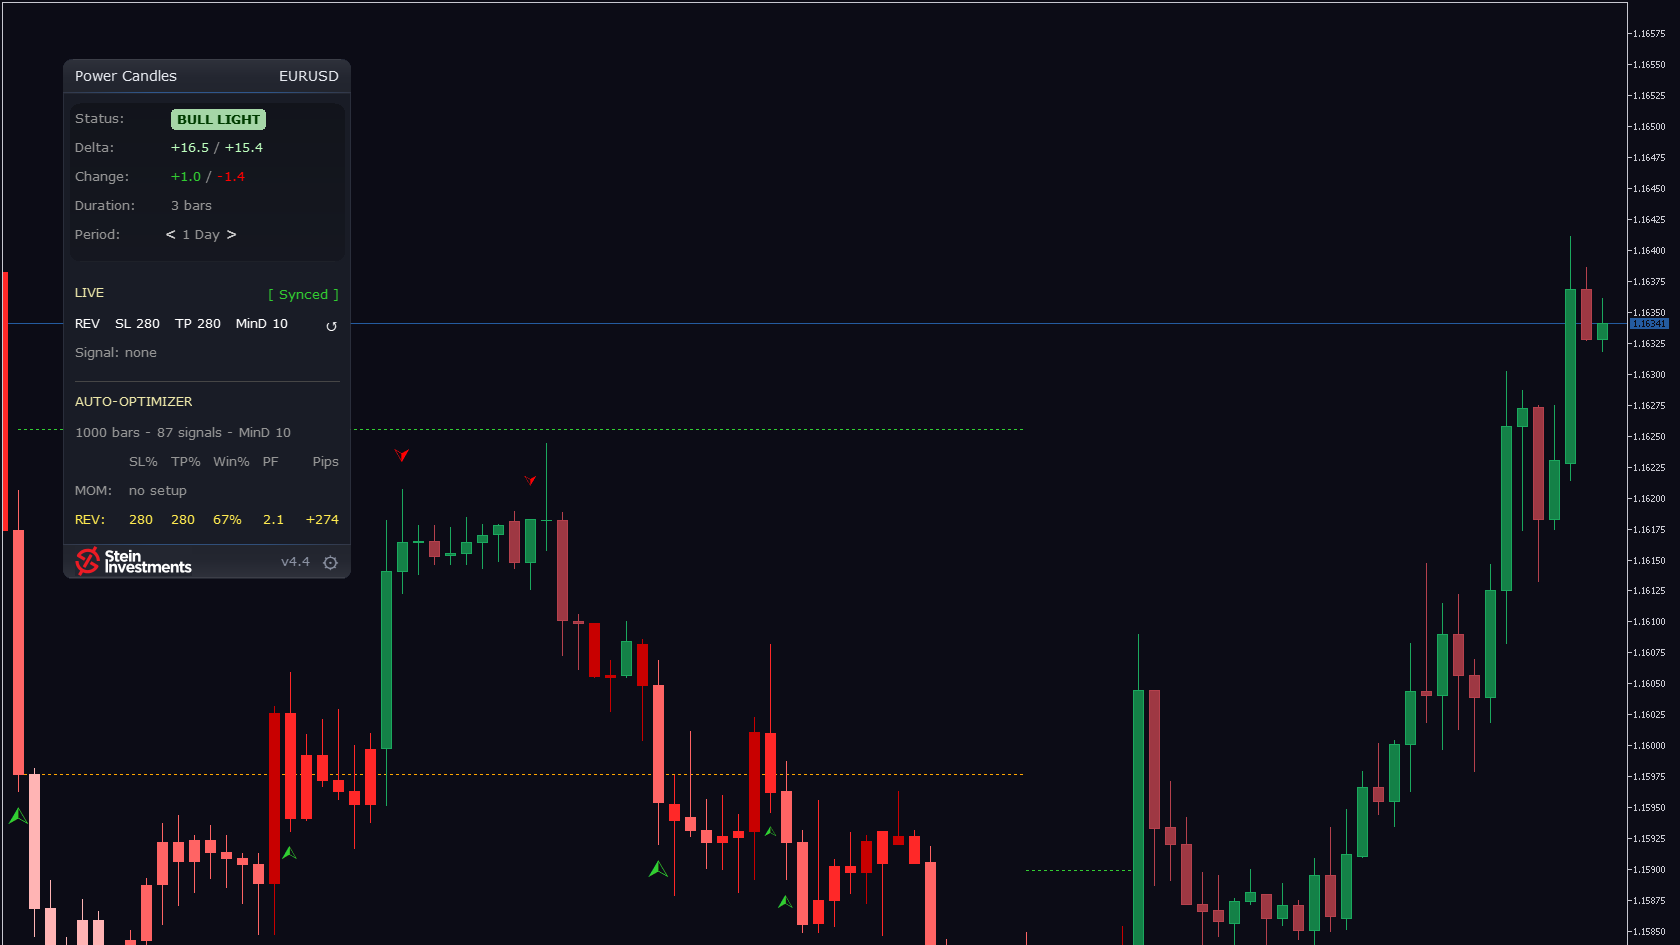
The indicator is installed, the chart is open, and the first thing a trader looks at is the arrows. On a fresh chart those arrows came from the classic momentum view, while the Auto-Optimizer table next to it already named the setup that measured best on the past candles of that very chart. Two setups on one screen: needless confusion in the first minute, and your feedback pointed us straight to it. Version 4.5 clears it up.
Auto-apply best is now on by default. The first chart after install lands on the setup that measured best on its own past candles, and it follows the optimizer from there: when the table names a new winner, the chart takes it over, once an open signal has closed. Entry, stop and target sit at the exact price from the first load, and the panel numbers, Win% and Profit Factor, belong to the setup you are actually looking at.
The switch stays yours: turn it off under Settings and the chart holds where it is, and a click on a strategy row switches it off as before, so a setup you picked by hand stays put. An install that already has the switch stored keeps that choice, on or off. The new default reaches the fresh installs, which is exactly where the first impression is made.
Four more changes ride along in 4.5, the first two from questions traders asked me.
After a setup change, the next arrow is the next signal. Whether you click a strategy row, press Apply Best or the optimizer follows a new winner, the panel reads "Signal: none, waiting for next" until the first new arrow after the switch, and that arrow opens the signal at a price you can still trade. The row under LIVE reads "Tested: 1000 bars, 42 signals", so the size of the test behind the table is named as what it is.
A spread floor for the stop. On fast timeframes and in quiet phases the stop distance can shrink below the spread. The new input "Min SL (x spread)", default 2, keeps a signal whose stop would sit under that floor off the chart and out of the optimizer alike, so the table measures what the chart would actually trade. 0 switches the floor off.
The panel folds to one line. A minus glyph at the right edge of the header folds the panel to header, one LIVE line and footer: the setup with stop and target on the left, the signal state on the right. The square glyph unfolds it, each chart remembers its own fold through timeframe changes and restarts, and the gear opens Settings from either state.
Lighter on busy charts. Every tool on a chart shares the chart's command queue, so Power Candles now reads the price scale at most once a second and only when a new arrow appears, and replaces its signal lines by name: a new bar is drawn from what the indicator already knows. A chart with several tools on it stays responsive on a new bar and on a timeframe change, and the new input "PerfLogging" writes a line to the Experts log for any phase over 250 ms, so a slow chart can be traced to its cause.
Version 4.5 is in the MQL5 Market now and reaches every owner of the indicator as a free update.
Week two of the autumn series ends on Sunday, 20 September at 23:59 CEST. Until then Power Candles holds 79 USD instead of 99. On Sunday night the list price is back.