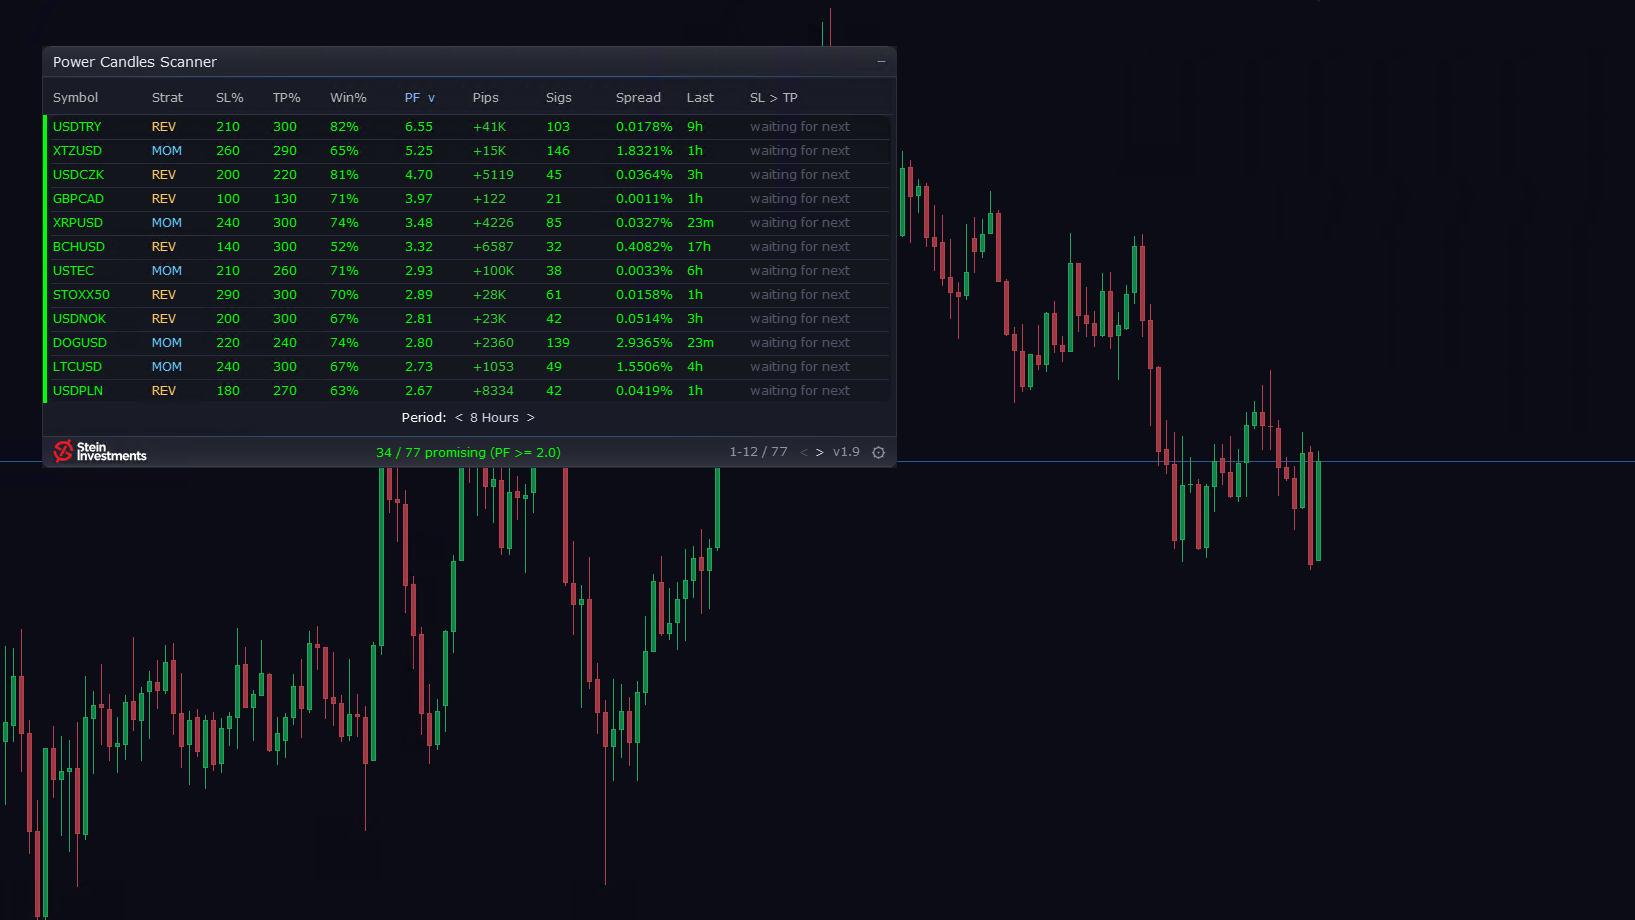
The longer the list of symbols, the more a scanner is worth, and the more the wait for the first full list counts.
That is where the first of this week's two updates starts. The panel appears the moment you attach the Scanner, and the list fills in one continuous pass, in about 80% less time than before, also after a change of calculation period. I timed it on my own terminal and rounded the figure down.
The same update brings five requests that traders sent me. The panel folds to a single status line, with the count of promising symbols on the left and of active signals on the right, while scan and alerts keep running. The new input "Instance name" puts a name in the panel header and on every alert, so with several scanners you see at once which one reported. "Min historical win rate" keeps only the symbols whose win rate on their past candles reaches your minimum. A new column shows the spread in percent of the mid price, one scale for forex, gold, indices and stocks. And two more filter fields make room for a long watchlist.
The second update lets you click freely through the list. Each chart keeps its calculation period through a symbol click and a restart. Each alert comes once, however often you click a symbol or restart the terminal. And the first scan after attaching, a restart or a change of period or inputs only fills the list, so every alert after it reports a change since that scan.
Both updates are in the MQL5 Market now and reach every owner of the Scanner for free.
Week three of the autumn series ends on Sunday, 27 September at 23:59 CEST. Until then the Power Candles Strategy Scanner holds 111 USD instead of 139. On Sunday night the list price is back.