My stop methods had proven themselves, and still they sometimes took me out of a trade too early.
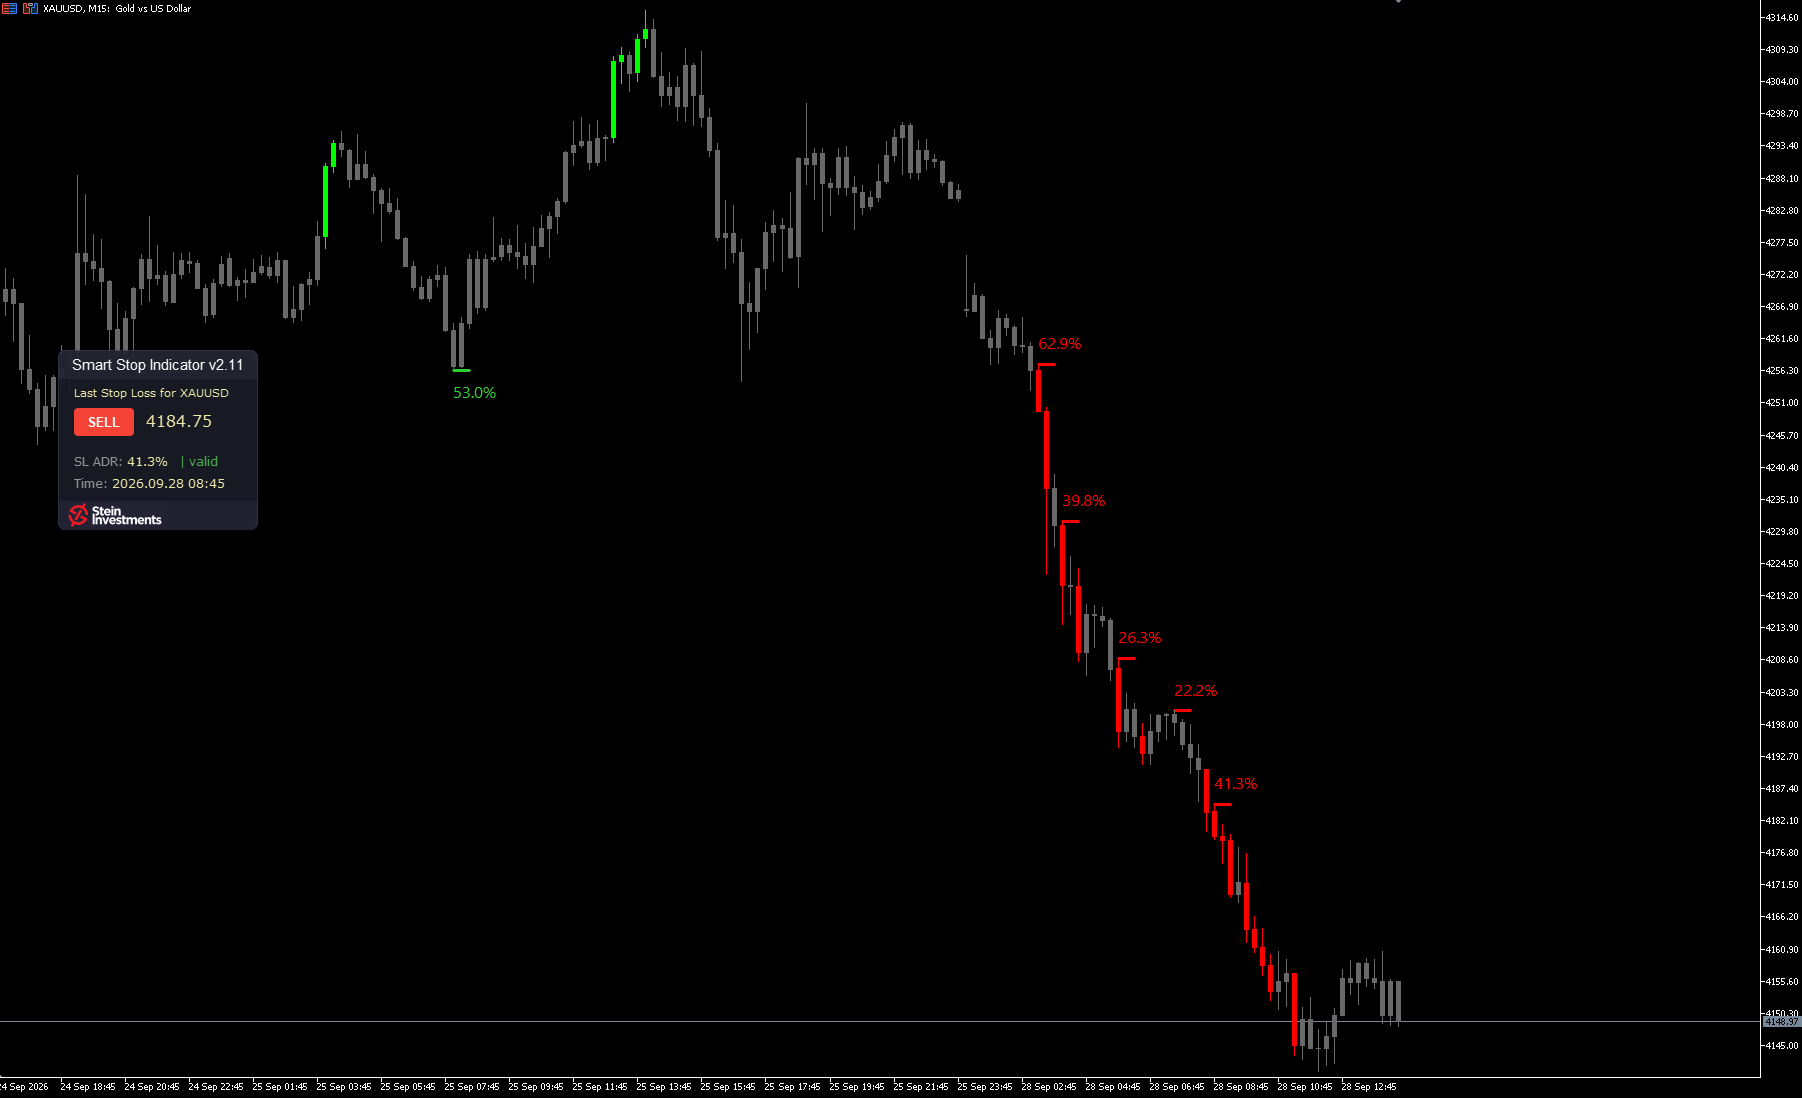
So I built a stop that reads the market structure and moves with it. The Smart Stop Indicator shows the most recent valid stop level on your chart, for the current direction, BUY or SELL. The panel gives you the exact price, its distance as a percentage of the Average Daily Range, and the status live: new, valid or broken. The level also sits as a line on the chart, and the candles carry the color of the direction.
The distance to the daily range tells you at a glance whether a stop is tight or wide. Alerts report a new level and a broken one, by pop-up, sound, push or e-mail, and an optional warning speaks up when price comes close to the stop. A broken level turns grey in the panel, so the valid one stands out.
The indicator is the on-chart part of the Smart Stop family. The Smart Stop Scanner finds the same levels across many symbols at once, and the Smart Stop Manager tightens the stop on your open trades. If you build your own EA, a lightweight mode hands it the level and switches off every visual element.
It runs on every MetaTrader 5 timeframe, with M5 and M15 as the sweet spot, on forex pairs, metals, crypto, indices and other CFDs. I took this one aspect of trading apart for a long time, and I ended up content with my work. It is one of my favorite products.
Three things to know before you buy. A new structure takes a little longer: after a broken level, the indicator waits for the next one, and until the chart offers a clean structure for a stop, the panel shows a dash, which is information too. The indicator gives you the stop, and the call on the trade stays yours. And the free demo that MQL5 attaches to it runs in the Strategy Tester.
This is week four of the autumn series: seven weeks, seven of my tools, each with its own week and exactly once, in a fixed order. The Smart Stop Indicator holds 59 USD instead of 79, 25% below the list price, until Sunday 4 October. Sunday night the list price is back, and it stays there.
Have a look, and see where the chart puts your stop.