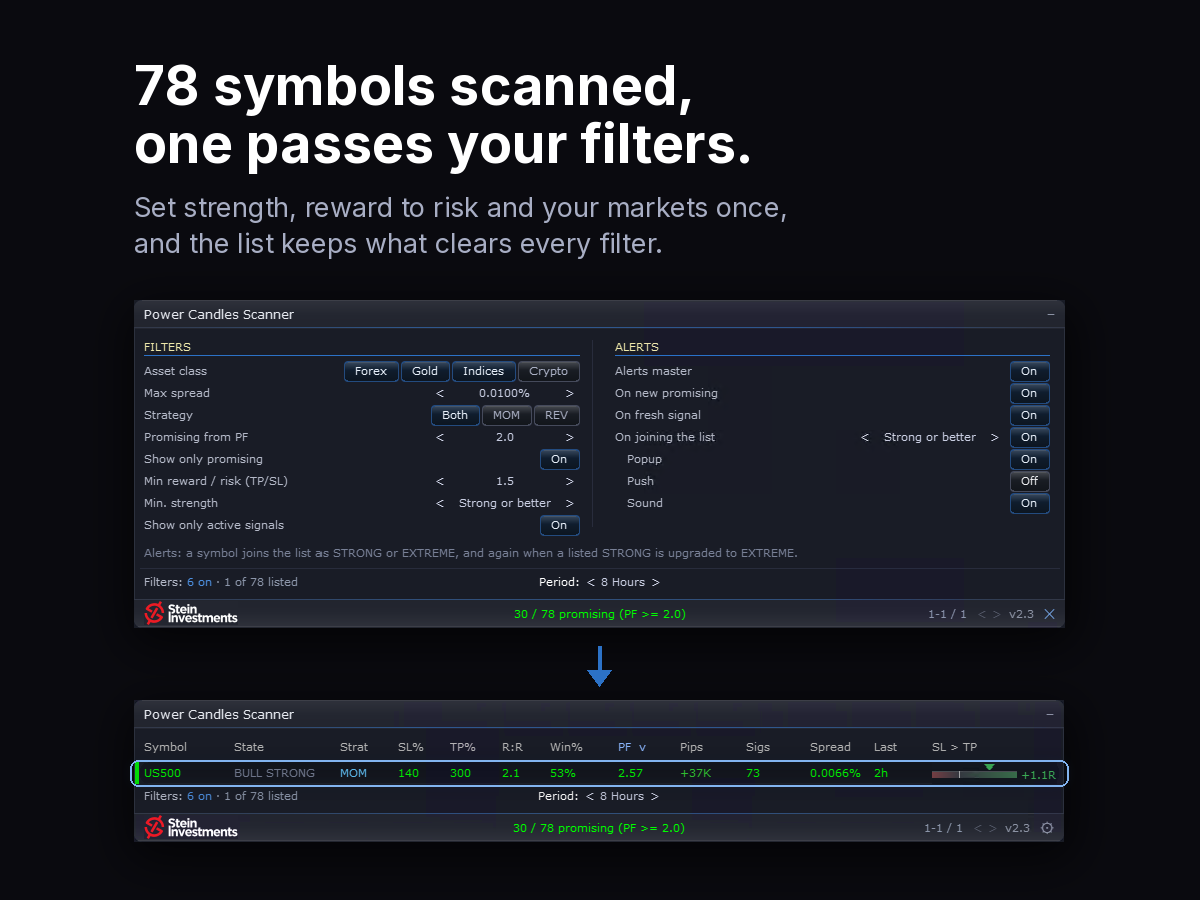
The scanner runs the Power Candles optimizer on every symbol in your Market Watch. That makes a long list, and on most days a handful of its rows are the ones you care about. You asked me for strong candles next to the extreme ones. So I built that filter, and a few more around it. Set them once, and the list keeps to the strong moves in your markets, at the reward you want. On my chart, Strong or better, a minimum reward to risk of 1.5 and a maximum spread of 0.01 %, together with "Show only promising" and "Show only active signals", leave one of 78 symbols: US500, BULL STRONG, at an R:R of 2.1.
Strength comes first. Every row now shows the Power Candles state of its last closed candle in a new State column, BULL and BEAR EXTREME in bold green and red, and a click on the header sorts the list by it. Set "Min. strength" to Strong or better or Extreme only, and the list narrows to the symbols whose last closed candle holds that level.
Reward to risk sits right in the row. The new R:R column stands next to SL% and TP% and sorts with one click. Set "Min reward / risk" to 1.2, 1.5 or 2, and the list keeps only the rows whose TP is at least that multiple of their SL. Every setup, SL and TP stays exactly as the optimizer calculated it. Your filters decide which rows you see.
Your markets, at your cost. Under "Asset class", Forex, Gold, Indices and Crypto switch on and off one by one, so the list holds exactly what you trade. "Max spread" sets a limit from 0.0020 % to 0.1000 % of the price and keeps the symbols that are cheap to trade right now. The profit factor behind "Show only promising" now sits right in the panel as "Promising from PF", from 1.5 to 3.0.
Your alerts follow your filters. Switch on "On joining the list" and pick the level in the same row. Right after the candle close the scanner tells you when a symbol joins the list your filters show and again when a listed symbol is upgraded to extreme, each with its R:R. Every symbol of one candle close arrives in one message. A row your filters hide stays silent, so every alert matches the list in front of you.
The main view shows how many filters are on and how many symbols they list, and a click on that line opens the settings. Every choice is kept per chart, so each scanner keeps its own view.
From the list to the chart: a click on a symbol in the list switches your chart to it. With Power Candles on the same chart, entry, SL and TP of the setup are drawn in.
If you own or rent the scanner, 2.3 is a free update in the MQL5 Market. New to it? Have a look at the product page.